
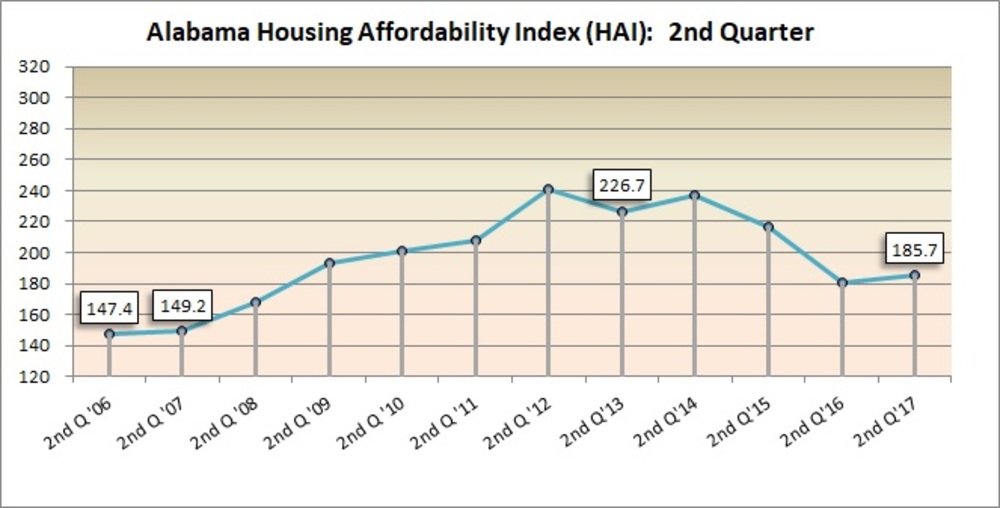
The Alabama Statewide Housing Affordability Index for the second quarter of 2017 was computed at 185.7. This quarter’s HAI increased compared to last quarter’s index of 178.8. The HAI is at its lowest on a quarterly basis since the second quarter of 2007.
The following chart shows the second quarter of the Alabama Housing Affordability Index over the past 11 years. The affordability index for the second quarter of 2017 increased from 178.8 during the second quarter of 2016 to 185.7 this year.
Click here to read the full report
The standard definition used by the Alabama Center for Real Estate in describing the statewide housing affordability index is as follows: “The statewide housing affordability index is calculated as the ratio of the state’s actual median family income to the income needed to purchase and finance the state’s median priced home. An index number of 100 means that a family earning the state’s median income has just enough buying power to qualify for a loan on the state’s median priced, single-family home, assuming standard underwriting criteria. The higher the index number is, the more affordable the housing.” The median home price for the quarter used for the calculation is computed from the median prices of homes sold in the reported areas during the last three months in Alabama. The composite monthly interest rate is the average the interest rates of the three months of the quarter of the effective rate of the national averages for all major lenders of loans closed on conventional mortgages as published by the Federal Housing Finance Agency.
The Alabama Housing Affordability Index of 185.7 calculated for the second quarter of 2017 means that an Alabama family which earned the statewide median income of $55,500 had a little over 1.8 times the income needed to qualify for a loan to purchase the statewide median priced home. Dothan, a city in the Metro Areas showed an affordability index of 195.7, approximately 1.9 times the income needed to qualify for a loan to purchase the statewide median priced home, while Montgomery showed an affordability index of 209.1, which is twice the necessary income for the statewide median home purchase. The median price of homes sold and the composite monthly interest rate are the two primary factors that fluctuate and affect the affordability of homes in Alabama, as well as in the nation.
The second quarter of 2017 showed an interest rate of 3.99%, a decrease from 4.16% in the first quarter of 2017. The composite monthly interest rates from the second quarter of 2016 to the second quarter of 2017 are listed below:
| Quarter | Composite Monthly Interest Rate |
| 2Q 2017 | 3.99% |
| 1Q 2017 | 4.16% |
| 4Q 2016 | 3.63% |
| 3Q 2016 | 3.73% |
| 2Q 2016 | 3.94% |
The following table shows the quarterly results in the median prices of homes sold from the third quarter of 2016 to the second quarter of 2017.
| Quarter | Median Sales Price of Alabama Homes |
| 2Q 2017 | $159,837 |
| 1Q 2017 | $147,785 |
| 4Q 2016 | $151,934 |
| 3Q 2016 | $159,351 |
The Estimated Median Family Income projections are produced by HUD and are provided annually. Following are the changes in the projections from 2016 to 2017. The projections show increases in income in 10 of seventeen areas. This is compared to nine areas, of the seventeen shown, that had reductions from 2015 to 2016 in Alabama. The national median family income shows a slight decrease of 3.56 percent.
On the national scene, the National Housing Affordability Index for the second quarter of 2017 was 116.3, 8.51 percent shy of the first quarter. The national median sales price for the second quarter of 2017 was $253,800, showing an increase in national housing prices from the first quarter’s median price of $231,233.
A review of the second quarter in the 2017 Alabama Housing Affordability Index revealed that ten areas in the Metro Area group in Alabama showed a decrease from the previous quarter. Lee County showed the most significant decrease from the first quarter of 2017 AHAI with an 38.10 percent decrease and an affordability index of 144.8, followed by Dothan with an HAI decrease of 20.41 percent which produced an affordability index of 195.7.
For the County Areas, the HAI results from the second quarter in 2017 showed that Cullman County had the strongest results and achieved a 103.91 percent increase with an affordability index of 195.6 (Please review the AHAI chart for specific details.)
*It should be noted that the numbers used to compute the AHAI reflect mostly urban areas, which have significantly higher income levels than those of rural areas in the state. Also in smaller volume reporting areas, a relatively small change can cause a large percent of increase or decrease. Please review the Monthly Housing Statistics posted on the ACRE website at http://www.acre.cba.ua.edu/ to review the volume of sales that produced the Median Home Price for each reporting area.
Alabama Affordability Index Percent Change by Rank – 2Q 2017 vs. 1Q 2017
Metro Areas by Rank:
| Baldwin | -4.40% |
| Tuscaloosa | -11.68% |
| Montgomery | -4.13% |
| Dothan | -20.41% |
| Lee | -38.10% |
| Birmingham | -13.02% |
| Huntsville | 2.51% |
| Muscle Shoals | 48.21% |
| Mobile | -8.51% |
| Gadsden | 25.15% |
| Calhoun | 40.64% |
County Areas by Rank:
| Marshall County | 23.97% |
| Walker County | -1.05% |
| Talladega County | -4.89% |
| Lake Martin | 0.14% |
| Monroe County | -11.13% |
| Cullman County | 103.91% |
| Statewide Avg. Percent Change: | 3.88% |
| US Avg. Percent Change: | -8.51% |