National Overview: Although single family permits for new construction increased 4.2 percent year-over-year (YoY) in 2018, 2019 is off to a slow start as January permits declined 6 percent from January 2018. Housing starts also declined 4.8 percent YoY in January. Even though the drop in permits and starts was slight, it will be interesting to see if the nationwide new construction market continues to trend downwards during the first quarter. If this is the case, there is cause for concern in Alabama as our residential markets tend to trail national trends by 12-18 months. A prolonged slowdown in new construction activity at the nationwide level could be interpreted as a warning sign for Alabama’s new construction market, although the downturn would not hit Alabama until mid-year 2020. On the positive side, this is just one month. Stay tuned to see if nationwide permits and starts recover in February, easing concerns about a potential downturn.
South Region Overview: After posting a 5 percent gain YoY in single family permits for new construction during 2018, 2019 is also off to a slow start in the South Region as January permits dropped 3.6 percent YoY. Housing starts were also down in January as they fell 1.9 percent from one year ago. Again, the declines are slight, but there will be cause for concern if these trends continue throughout 2019.
Not surprisingly, the 15 states in the South Region accounted for over half (52 percent) of the nation’s new construction activity in 2018. Of the 854,241 single family permits for new construction issued in 2018, 446,748 were in the South Region. Texas and Florida alone accounted for 26 percent of all permits nationwide. Twelve of the 15 states in the region reported single family permit gains from 2017. Florida was home to the highest growth rate at 13 percent, while the state with the largest decline was Virginia with a drop of 9.1 percent.
The following list ranks states in the South Region by 2018 single family permits:
- 1. Texas – 123,249 (8.0%)
- 2. Florida – 94,836 (13.0%)
- 3. North Carolina – 48,071 (3.4%)
- 4. Georgia – 41,377 (4.1%)
- 5. South Carolina – 29,704 (4.8%)
- 6. Tennessee – 28,448 (2.6%)
- 7. Virginia – 21,139 (-9.1)
- 8. Louisiana – 14,433 (8.2%)
- 9. Alabama – 12,919 (7.9%)
- 10. Maryland – 12,767 (4.3%)
- 11. Oklahoma – 9,390 (-2.5%)
- 12. Kentucky – 8,201 (-2.5%)
- 13. Mississippi – 6,460 (-5.4%)
- 14. Delaware – 5,469 (3.9%)
- 15. West Virginia – 2,229 (0.8%)
- 16. District of Columbia – 112 (-68.2%)
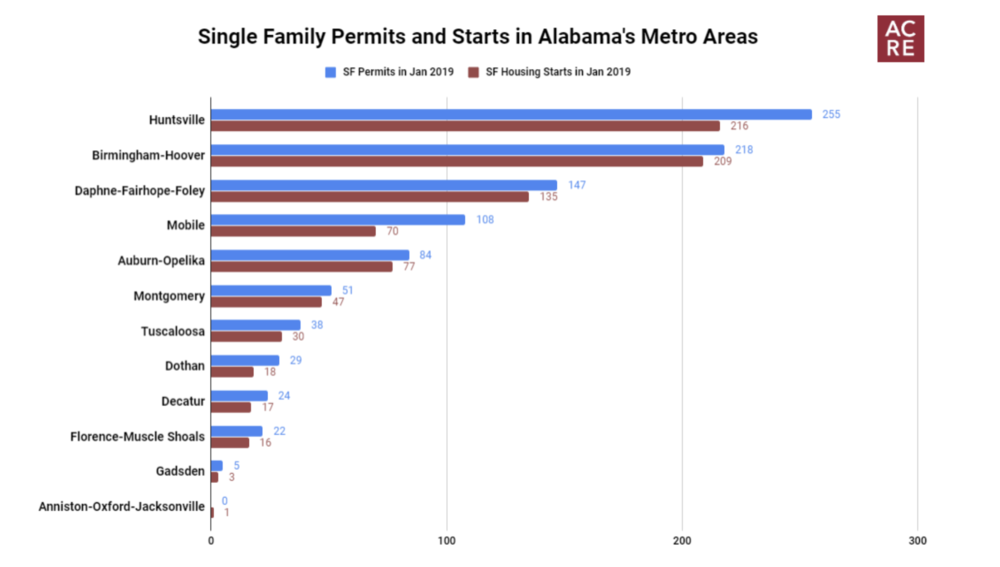
Statewide Overview: Alabama’s new construction market is off to a fast start in January 2019 as it went against nationwide and regional trends by posting a 5.7 percent YoY gain in permits and a 2.8 percent gain in housing starts. Of the 1,079 single family permits issued in January, 255, or 24 percent, were in the Huntsville metro area where permits grew by an impressive 43.3 percent from January 2018. The Birmingham metro area also saw increased new construction activity as permits increased 17.2 percent from 199 one year ago to 218 currently. Nine of Alabama’s 12 metro areas experienced permit gains from one year ago with Decatur leading the way with a 166.7 percent increase YoY. Auburn-Opelika has a strong new construction market so it was surprising to see it among the 3 areas with January permit declines. Sales in the area, however, remained strong as 30.3 percent of all residential sales in Auburn-Opelika were new construction. The other two metro areas with permit drops were Daphne-Fairhope-Foley (-3.9 percent) and Anniston-Oxford-Jacksonville (-100%).
The following list ranks Alabama’s metro areas by January 2019 single family permits:
- 1. Huntsville – 255 (43.3%)
- 2. Birmingham-Hoover – 218 (17.2%)
- 3. Daphne-Fairhope-Foley – 147 (-3.9%)
- 4. Mobile – 108 (52.1%)
- 5. Auburn-Opelika – 84 (-13.4%)
- 6. Montgomery – 51 (15.9%)
- 7. Tuscaloosa – 38 (8.6%)
- 8. Dothan – 29 (52.6%)
- 9. Decatur – 24 (166.7%)
- 10. Florence-Muscle Shoals – 22 (83.3%)
- 11. Gadsden – 5 (66.7%)
- 12. Anniston-Oxford-Jacksonville – 0 (-100%)